Metrics That Move Sales Efficiency ⚡️
Getting value from metrics that matter for small to medium businesses
Introduction
Who doesn’t want more efficiency from their sales team? After all, more efficiency means more dollars on the bottom line 🚀
By tracking the right metrics that guide you on what's working, what isn't, and what can be improved, businesses can take action to improve sales efficiency and ultimately results. But how do you identify the metrics that matter, and how they can be easily applied to improve sales performance?
In this guide, we’ve done that for you. Read on to understand the essential sales metrics for small to medium businesses, the 'power metrics' to track and improve team performance, with sales scorecards and best practices you can easily implement from today.

- Essential sales metrics
- Power metrics
- Quarterly sales scorecard
- Scorecards by sales role
- SDR scorecard
- AE scorecard
- BDM scorecard
- Improving sales efficiency with Qwilr
- Recommendations
Essential sales metrics
Let's first take a look at some common metrics that are relevant to (and used by) pretty much every sales team around the world. On their own, these metrics provide valuable insights that can identify strengths and weaknesses in your sales approach.
Win rate or conversion rate, represents the average percentage of deals that were closed-won over a set period (eg. a month, quarter, or year). Divide the total number of opportunities generated in your set period, by the number of those that were closed-won deals to calculate your win rate.
What does it tell you?
Win rates should be consistent (or improving) every quarter but if they drop, examine the exit points of your lost deals to determine and address the root cause.
Average deal size/value is the average revenue you expect to make from each new deal. Establish your average deal size by dividing the total value of deals won over a set period, by the total number of deals.
What does it tell you?
If your average deal size starts to decline, either your prospects are buying fewer units or fewer products and/or services.

Pipeline coverage is the total amount of opportunity value needed in your sales pipeline to ensure you hit your sales target. Many organizations calculate the pipeline coverage needed based on their win rate. For example, if you have a $1M sales target and know you have a 50% win rate on qualified leads, then your pipeline coverage needs to be 2x.
What does it tell you?
Pipeline coverage is of course fluid and will rise and fall through any given quarter, as deals enter and exit the sales process, so it's important to monitor this one every week.
Tracking these common metrics enables sales and business leaders to establish a benchmark for their sales performance, and helps to set quotas and expectations for sales reps.
Power metrics 💪
Once you're tracking the essential metrics, you can use those results to calculate two ‘power metrics’ that have gained traction as sales and business leaders modernize their approach to sales:
- Sales Velocity
- Sales Efficiency
Let’s dive into each and break down what they measure and how they can improve performance.
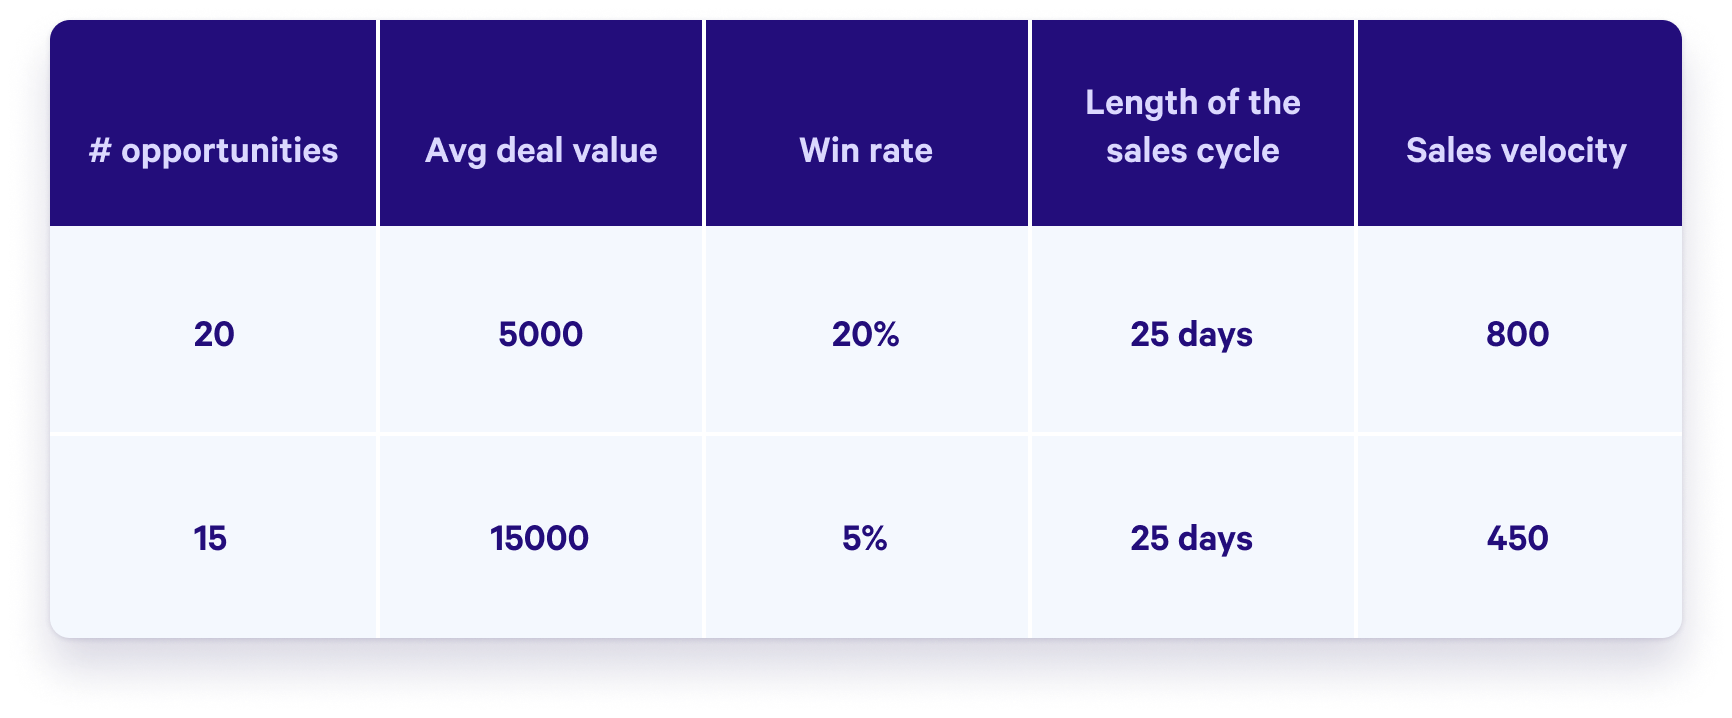
Sales velocity measures how quickly deals move through your pipeline and generate revenue, and is a valuable indicator of pipeline health. It considers the number of opportunities, average deal size, win rate (or conversion rate), and length of the sales cycle.
Sales velocity is often represented as a formula:

To calculate sales velocity, simply multiply the number of opportunities within a set period of time by the average deal value, then multiply by the win rate. Divide that figure by the average length of the sales cycle within the same period and eureka – you have your score. The higher the number, the quicker you are moving customers through the sales pipeline.
For example:

Why track sales velocity?
Sales velocity is more than a metric of good vs bad.
- 1.Understanding and tracking sales velocity scores gives leaders insight into their teams' capacity to close total revenue over a set period, leading to better planning.
- 2.Sales velocity can be applied to rank and improve individual sales performance by ranking each of their territory’s scores. However, reps of course need to be assessed like for like, so avoid stack ranking salespeople who operate in different markets eg. enterprise vs SME, or have other such factors that can impact deal size, conversion rates, or deal volume. By comparing individual sales velocity you can identify inhibitors to their sales success. For example, reps with lower win rates may need further enablement training.
Want to know how your Sales Velocity score ranks? Use Qwilr’s Sales Velocity Calculator to see how your team’s performance stacks up against benchmark data from 800+ B2B companies >
Sales efficiency refers to the ability to drive more revenue from your available resources, or driving the same revenue using fewer resources. It’s calculated by dividing the gross revenue generated by the sales team, by the operating costs incurred by generating it.
Your sales efficiency score indicates whether your sales process, methods, and go-to-market (GTM) strategy are working. Sales efficiency should have a score that is greater than 1, or 100%. The higher the score, the better.

Sales efficiency should either remain the same or increase quarter on quarter, meaning that your sales team is performing as well as or better than previous quarters.
Ways to increase sales efficiency
Leaders can adopt different strategies to improve sales efficiency:
- 1.Increase your average deal size with bundles or upsell motions.
- 2.Reduce the length of the sales cycle in order to close more deals within the set period. Examine and identify friction points that draw deal cycles out for longer than necessary.
- 3.Improve win rates of course, everyone would love to win more business, but if win rates are a weak link then you might need to refine your GTM strategy (think industry verticals and Ideal Customer Profile (ICP) ) and/or coach and enable your sales team.

Scorecards
The above metrics all focus on the results generated by your sales team as a whole. But what about the metrics tied to individual performance?
A sales scorecard is a simple tool to track individual salesperson efficiency and performance tied to the team’s goals. It gives you ongoing insight into your reps' progress and identifies opportunities for coaching and further enablement.
Scorecards are also a great tool to keep team members accountable, highlight and reward top performers, and gamify your processes to create healthy competition. Beyond just setting individual goals, tracking sales activities leads to higher sales team performance which improves overall efficiency and positively impacts the bottom line.
Here we’ve included examples of simple scorecards for different roles in the sales organization:
- Sales Development Rep (SDR) / Business Development Rep (BDR)
- Account Executive (AE)
- Business Development Manager (BDM)
(This is dynamic☝️click on the relevant tab to see each scorecard)
While it helps to see examples from others and there are many sales scorecard templates online, it’s important that your scorecard is made up of the right elements for your team.
Performance metrics are different for every company, but they all have one thing in common: they drive your team. Make sure whatever you select for your scorecard is meaningful for your team, and each role has a scorecard reflecting their performance.
For more guidance see “How to create a sales scorecard - the sales leaders guide”.
Improve sales efficiency with Qwilr
According to this report by Salesforce, sales reps spend just 28% of their time selling. Qwilr is designed to help ambitious sales teams create more efficiency in their sales process and get selling time back by:
- Spending less time on admin
- Making it easy for your buyer to say 'yes'
- Using buyer insights to drive deals forward
- Automatically tracking metrics that guide you on sales efficiency
1. Automate the work that slows down every deal
With Qwilr, sales reps can create interactive proposals and quotes that impress buyers, direct from the CRM in a few simple clicks. No more hours spent building customized proposals, copying and pasting data, and having endless revisions of documents.

2. Make it easier for buyers to BUY

Buying in 2023 is incredibly hard! Delivering an excellent buyer experience makes it easy for buyers to internally drive a consensus.
Qwilr pages make champions look good and eliminate the need for endless steps in the process.
Inbuilt features including interactive pricing, native esignature, and digital payments, empower buyers to quickly reach a decision and sign.
3. Optimize follow-up in the final stages of the deal
Because Qwilr pages are built on the web, you can track what buyers are reading and clicking on within pages and get notified whenever your buyer takes action.
Know how to follow up by identifying who is looking at proposals, how long they engage, and what they’re interested in.


Use Qwilr's unique Buyer Engagement tracker to understand whether there is true interest in a deal, and ruthlessly prioritize which deals to spend energy on.
4. Track metrics that matter for efficiency
Get a complete view of where each proposal is within Qwilr. Know where deals are stuck, whether they’re waiting to be signed, or what proposals still need to be sent to buyers.
Understand your overall velocity at a glance, with Qwilr's pipeline report and sales velocity calculation.

Recommendations:
- 1.If you're not already measuring sales velocity and efficiency - now is the time to start! We recommend tracking monthly or quarterly.
- 2.When introducing scorecards to your sales team, ensure they understand what you are measuring and why. For an added boost, consider creating healthy competition by gamifying your scorecards with a fun incentive.
- 3.What is measured, can be managed! Tracking metrics will show you where your sales team needs more training or coaching. Use the insights you track to prioritize sales enablement.
- 4.Use tools like Qwilr to automate, optimize, and improve your sales workflow and deliver unique buyer insights. Book a demo today!
See what our customer's say...
A modern way to sell
Cut through the noise with interactive proposals, quotes and contracts. Get notified when a buyer takes action.

Modernize your approach to sales with Qwilr, and benefit from:
- Improved buyer engagement with standout, personalized sales collateral that's always on brand
- Increased sales productivity with less time spent on admin and more time to sell
- Faster decision-making by enabling buyers with the information they need, and that's easy to share with the buying committee
- Unique buyer insights from Qwilr’s sales intelligence, enabling sellers to reach a ‘yes’ or ‘no’ faster
- Improved sales velocity move deals through the sales cycle quickly and efficiently
It's easy to create high-performing proposals and other documents at speed with Qwilr. Check out our library of 110+ free professional templates and get started on a free 14-day trial today.
